Microsoft Excel is a powerful spreadsheet application used for tasks ranging from basic data entry to complex financial modeling. While Excel's interface may seem user-friendly, understanding its terminology is crucial for effectively utilizing its features. In this comprehensive guide, we will delve into Microsoft Excel terminology, explaining key concepts and functions to help you become proficient in this essential software.
Workbook, Worksheet, and Cell
- Workbook: A workbook in Excel is the top-level container that holds your data, worksheets, charts, and other objects. It's essentially a file with an ".xlsx" extension and can contain multiple worksheets.
- Worksheet: A worksheet, also referred to as a spreadsheet, is a single page contains grid of rows and columns where you enter, calculate, and analyze data. A workbook can have multiple worksheets, each identified by a tab at the bottom.
- Cell: The smallest unit in Excel is a cell. It's where you enter data, such as numbers, text, or formulas. Cells are organized in rows (numbered) and columns (lettered), with a unique cell reference (e.g., A1, B2) based on their row and column position.
Data Types
- Text: Text data type includes letters, numbers, symbols, and spaces. Text cells are typically left-aligned in Excel.
- Number: Number data type includes whole numbers, decimals, and dates. Numeric cells can be formatted for various purposes, such as currency, percentage, or date.
- Formula: A formula is an expression used to perform calculations on data in Excel. Formulas start with an equal sign (=) and can contain functions, cell references, operators, and constants.
Functions
- Functions: Functions are predefined formulas that perform specific calculations or tasks. Excel offers a wide range of functions for mathematical, statistical, financial, and text-related operations. Common examples include SUM, AVERAGE, IF, and VLOOKUP.
- Arguments: Arguments are the inputs you provide to a function. Functions may require one or multiple arguments, which can be values, cell references, or other functions.
- Syntax: Syntax refers to the rules and structure that must be followed when using a function. Understanding the correct syntax is essential for functions to work correctly.
- AutoSum: AutoSum is a quick way to sum a range of cells. It automatically generates a SUM formula for the selected cells.
Data Manipulation
- Copy and Paste: Copying allows you to duplicate data, formulas, or formatting. Pasting inserts the copied content into a new location.
- Cut and Paste: Cutting removes the selected data from its original location, while pasting inserts it elsewhere.
- Fill Handle: The Fill Handle is a small square in the bottom-right corner of a selected cell. It's used to extend data series, copy formulas, and create patterns by dragging it across cells.
- Sort: Sorting arranges data in ascending or descending order based on selected criteria, such as alphabetical or numerical order.
- Filter: Filtering displays a subset of data based on specific criteria, temporarily hiding rows that don't meet the filter conditions.
- Data Validation: Data validation restricts the type and range of data that can be entered into a cell. It helps maintain data integrity and consistency.
- Text to Columns: This feature allows you to split text in a cell into multiple columns based on a delimiter (e.g., comma, space).
Formatting
- Cell Format: Cell format refers to how a cell displays its content. You can change the format to control aspects like font, color, alignment, and number format.
- Conditional Formatting: Conditional formatting enables you to highlight cells based on specific conditions. For example, you can color-code cells that contain values above a certain threshold.
- Cell Styles: Cell styles are predefined formatting options that can be applied to cells, making it easy to maintain a consistent look and feel in your spreadsheet.
- Borders and Gridlines: Borders are lines that can be added around cells or cell ranges. Gridlines are the faint lines that separate cells in a worksheet.
Charts and Graphics
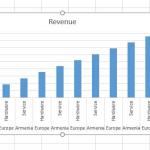
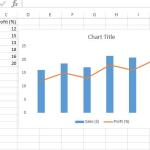
- Chart: A chart is a graphical representation of data. Excel offers various chart types, including bar charts, line charts, pie charts, and scatter plots.
- Axis: In a chart, the axis is a reference line used to measure and display data. A chart typically has a horizontal (x) axis and a vertical (y) axis.
- Legend: The legend in a chart provides context for the data series by explaining what each color or symbol represents.
- Data Labels: Data labels are text or values displayed on a chart to provide additional information about data points.
- Sparklines: Sparklines are miniature charts that fit within a single cell, providing a visual summary of data trends.
PivotTables and PivotCharts
- PivotTable: A PivotTable is a data summarization tool that allows you to analyze and manipulate data dynamically. It's especially useful for large datasets.
- PivotChart: A PivotChart is a graphical representation of data from a PivotTable. It offers interactive features for data exploration.
- Slicers: Slicers are visual filters that allow you to interactively filter data in a PivotTable or PivotChart.
Data Analysis
- Data Analysis ToolPak: The Data Analysis ToolPak is an Excel add-in that provides advanced data analysis tools such as regression analysis, histogram, and moving averages.
- Solver: Solver is an add-in that helps you find the optimal solution for complex problems by adjusting variables within specified constraints.
Data Import and Export
- Import Data: You can import data from external sources like text files, databases, and online services directly into Excel using tools like Power Query.
- Export Data: Excel allows you to export your worksheets or charts to various file formats, including PDF, CSV, and HTML.
Data Protection
- Password Protection: You can password-protect your Excel workbooks and worksheets to prevent unauthorized access or modifications.
- Sheet Protection: Sheet protection restricts users from making changes to specific worksheets within a workbook.
- Cell Locking: Cell locking allows you to protect specific cells within a worksheet while leaving others editable.
Collaboration and Sharing
- Share Workbook: The Share Workbook feature allows multiple users to collaborate on a workbook simultaneously, with real-time updates.
- Track Changes: Excel's Track Changes feature lets you monitor and review changes made by collaborators in shared workbooks.
Macros and VBA
- Macro: A macro is a recorded series of actions that can be replayed to automate repetitive tasks in Excel.
- VBA (Visual Basic for Applications): VBA is a programming language integrated into Excel. It allows you to write custom macros and automate complex tasks.
- Developer Tab: The Developer tab is a special ribbon tab that provides access to advanced Excel features, including macros and VBA.
Errors and Troubleshooting
- #VALUE!: This error occurs when a cell contains an inappropriate data type or when a formula references cells that contain text when numeric values are expected.
- #REF!: The #REF! error indicates that a cell reference is invalid, often due to deleted rows or columns.
- #DIV/0!: This error appears when you attempt to divide by zero, which is mathematically undefined.
- #N/A: The #N/A error indicates that Excel cannot find the value it's looking for, often seen in lookup and reference functions.
Advanced Features
- Array Formula: An array formula is a special type of formula that can perform multiple calculations on one or more items in an array.
- Data Tables: Data tables allow you to perform "what-if" analysis by varying one or two input values in a formula to see how they affect the results.
- Goal Seek: Goal Seek is a feature that helps you find the input value needed to achieve a specific result in a formula.
- Solver: Solver is an advanced tool that can find optimal solutions by changing multiple variables in a formula while adhering to constraints.
- Power Query: Power Query is a data transformation and connection tool that allows you to retrieve, shape, and merge data from various sources.
Conclusion
Microsoft Excel is a multifaceted tool with an extensive array of features and terminology. Understanding these concepts is essential for effective data manipulation, analysis, and reporting. Whether you're a beginner looking to organize your data or an advanced user seeking to perform complex analyses, mastering Excel terminology is a critical step in harnessing the full potential of this versatile spreadsheet software. Continuously exploring and practicing these concepts will empower you to work more efficiently and make informed decisions based on your data.