When I first opened Microsoft Excel, I’ll be honest—it looked like a mathematical battlefield.Rows,columns,cells,grids... all staring back at me like they expected me to know what to do.Then I discovered Excel formulas—and suddenly,Excel went from intimidating to incredibly empowering.In this tutorial, we’ll walk through the magic of Excel formulas—just as I wish someone had done for me on day one
Let’s start with the basics. A formula in Excel is an instruction that tells Excel what calculation or operation to perform. It can be as simple as adding two numbers or as complex as analyzing an entire dataset.
All formulas in Excel begin with an equal sign =. This signals Excel to expect a calculation or expression—not plain text.
=A1+B1
In this example, Excel adds the values in cells A1 and B1. You press Enter, and voilà—Excel does the math for you!
Why Learn Excel Formulas?
Formulas save time, reduce human error, and help automate repetitive calculations. Whether you’re tracking expenses, grading students, or analyzing business data—formulas turn raw data into meaningful insights with a few keystrokes.
How to Write a Formula: Step-by-Step
Step 1: Start with an Equal Sign
Always begin with =. Without it, Excel will think you’re typing plain text.
Step 2: Add Your Values or Cell References
You can use direct numbers like =5+3 or use cell references like =A1+B1. Cell references are more flexible because if the data changes, the formula updates automatically.
Step 3: Press Enter
Hit Enter, and Excel instantly calculates the result. No calculator needed!
Types of Cell References
Before diving into common formulas, let’s understand how cell references work. These references tell Excel which cells to use in the formula.
Relative Reference: Changes when copied. Example: =A1+B1
Mixed Reference: Locks either row or column. Example: =$A1+B$1
Commonly Used Excel Formulas for Beginners
Here’s a quick reference table of the most frequently used formulas that every beginner should know:
Formula
Purpose
Example
=SUM(A1:A5)
Adds all numbers in the range
Find total marks or expenses
=AVERAGE(B1:B5)
Calculates the average of a range
Find average sales or test scores
=MIN(C1:C10)
Finds the smallest number in a range
Identify the lowest score or expense
=MAX(C1:C10)
Finds the largest number in a range
Identify top marks or highest profit
=COUNT(D1:D20)
Counts cells with numbers
Count total numeric entries
=IF(E1>50,"Pass","Fail")
Applies conditional logic
Check if a student passed or failed
=TODAY()
Displays current date
Use in reports or timesheets
=LEN(F1)
Counts number of characters in text
Useful for data validation
=CONCAT(A1," ",B1)
Combines text from multiple cells
Join first and last names
=ROUND(G1,2)
Rounds a number to specified decimals
Round currency or percentage values
Let’s Practice: A Real-World Example
Imagine you’re tracking student marks across three subjects (Math, Science, and English). You want to calculate their total and average scores.
Here’s how:
In cell D2, type:
=SUM(B2:C2)
This will give you the total marks for the first student.
In cell E2, type:
=AVERAGE(B2:C2)
to get the average score.
Use the Fill Handle (that little square at the bottom right of the cell) to drag the formula down for the rest of the students.
Congratulations! You’ve just automated what could have been hours of manual calculation.
Pro Tips for Mastering Formulas
Double-click the formula cell to see which cells are being used.
Use parentheses() to control the order of operations.
Press F2 to quickly edit a formula.
Use AutoSum (Σ icon) to instantly sum up columns or rows.
Check for errors: Common ones include:
#DIV/0! — Division by zero
#VALUE! — Wrong data type
#REF! — Invalid cell reference
Wrap-Up: Becoming Friends with Formulas
Formulas are not scary—they’re your best friends in Excel. Once you get used to them, they’ll make your data analysis smoother, faster, and way more fun. Start small—try the basic formulas, experiment with your own data, and soon you’ll be the go-to Excel expert at your workplace (or at least among your friends!).
Remember—Excel isn’t about memorizing formulas; it’s about understanding what you want to achieve. Once you know the goal, the formula is your shortcut to success.
If you’ve ever looked at a financial report or a sales dashboard and wondered, “How did they visualize this so clearly?”, chances are you saw a Waterfall or a Funnel chart.
These two charts are not just visually appealing — they are powerful tools for explaining change and progress.
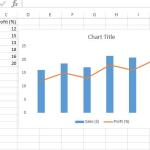
In this tutorial, we’ll explore what a secondary axis is, why you need it, and how to add it step by step in Excel. By the end, you’ll be able to compare data with different scales like a pro.
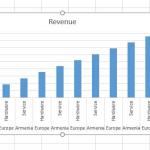
Sparklines are miniature charts that fit neatly inside a single Excel cell. They display trends or variations in a series of data points — such as sales performance, temperature changes, or stock prices — without taking up much space.
This website uses cookies to enhance your browsing experience. By continuing to use this site, you consent to the use of cookies. Please review our Privacy Policy for more information on how we handle your data. Cookie Policy
These cookies are essential for the website to function properly.
These cookies help us understand how visitors interact with the website.
These cookies are used to deliver personalized advertisements.