Microsoft Excel is one of the most widely used software tools in the world today. From small businesses to large corporations, academic institutions, and government organizations, Excel plays a critical role in managing data, performing calculations, and creating visual reports. If you are completely new to Excel, this guide will provide you with a comprehensive introduction, covering everything from basic navigation and data entry to formulas, formatting, and charts. By the end of this article, you will have a strong foundation to use Excel confidently in your daily work.
Introduction to Microsoft Excel
Microsoft Excel is a spreadsheet program developed by Microsoft as part of the Microsoft Office Suite. It allows users to organize data into rows and columns, perform calculations, analyze information, and visualize it with charts and graphs. Since its release in 1985, Excel has evolved into a robust tool with hundreds of features that make it a cornerstone in data management and business intelligence.
Why Learn Excel?
Learning Excel is no longer optional—it is a skill expected in nearly every profession. Here are a few reasons why Excel is essential:
- Data Management: Store, organize, and manipulate large sets of data efficiently.
- Calculations: Automate complex mathematical operations with formulas and functions.
- Data Analysis: Summarize information using tables, charts, and PivotTables.
- Career Growth: Employers across industries seek candidates with Excel knowledge.
- Decision Making: Visualize data trends and insights to make better business decisions.
Understanding the Excel Interface
Before diving into data entry and formulas, it’s important to understand the Excel workspace:
The Ribbon
The Ribbon is the toolbar at the top of the window. It consists of tabs such as:
- Home: Basic formatting, alignment, and editing tools.
- Insert: Options to add charts, images, shapes, and tables.
- Formulas: Built-in functions and formula auditing tools.
- Data: Tools for sorting, filtering, and data connections.
- Review: Spelling checks, comments, and workbook protection.

Worksheet Area
The worksheet is made up of rows (horizontal, numbered 1, 2, 3…) and columns (vertical, labeled A, B, C…). The intersection of a row and column is called a cell. Each cell has a unique address like A1 (Column A, Row 1).

The Formula Bar
Located above the worksheet, the Formula Bar displays the contents of the selected cell. It’s also where you type formulas and functions.

Workbooks and Worksheets
An Excel file is called a workbook, and it contains one or more worksheets. Think of a workbook as a book, and worksheets as individual pages.
- To add a new worksheet: Click the + icon at the bottom.
- To rename: Right-click the sheet tab → Rename.
- To move or copy: Right-click → Move or Copy.
Basic Data Entry and Navigation
Excel is designed to handle both numbers and text. To enter data:
- Click on a cell and type.
- Press Enter to move down, or Tab to move right.
Example: Entering a Simple Dataset
Name    Age    City
John    25     New York
Sara    30     London
Mike    28     Toronto
Emma    32     Sydney
Each piece of information is stored in its own cell, making it easier to sort, filter, and calculate later.
Formulas are the backbone of Excel. They allow you to perform calculations using the data in your worksheet. Every formula starts with an equal sign (=).
Basic Arithmetic Operations
=5+3   → Result: 8
=10-4  → Result: 6
=6*7   → Result: 42
=20/5  → Result: 4
Cell References
Instead of typing numbers directly, you can use cell references:
=A1+B1   → Adds values in cells A1 and B1
=C1*D1   → Multiplies values in cells C1 and D1
Common Functions
Excel has hundreds of built-in functions. Here are a few essential ones:
=SUM(A1:A10)       → Adds numbers in range A1 to A10
=AVERAGE(B1:B10)   → Finds average of numbers in range
=MAX(C1:C8)        → Finds largest value
=MIN(C1:C8)        → Finds smallest value
=COUNT(D1:D20)     → Counts numeric values in range
Formatting makes your data visually appealing and easier to interpret.
Number Formatting
You can format data as currency, percentage, or date:
Select range → Right-click → Format Cells → Number
Text Formatting
- Bold, Italic, Underline for emphasis.
- Change font color and fill color.
- Adjust alignment: left, center, right.
Conditional Formatting
This feature automatically highlights cells based on rules.
Home → Conditional Formatting → Highlight Cell Rules
For example, you can highlight all values greater than 50 in red.
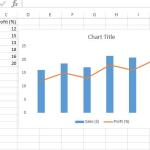
Creating and Customizing Charts
Charts help you present your data visually.
Steps to Create a Chart
1. Select the data range (e.g., A1:B5).
2. Go to Insert → Choose a Chart type (Column, Line, Pie).
3. Use Chart Tools to customize style, labels, and colors.
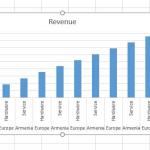
Example Dataset for Chart
Month   Sales
Jan     500
Feb     750
Mar     1200
Apr     900
Turning this into a column chart provides a quick visualization of monthly sales growth.
Working with Tables and Data Ranges
Tables allow you to manage structured data efficiently.
Creating a Table
1. Select your data.
2. Go to Insert → Table.
3. Confirm "My table has headers".
Sorting and Filtering
Tables automatically provide drop-down menus for sorting and filtering data by values, color, or conditions.
Useful Shortcuts and Productivity Tips
- Ctrl + N → New workbook
- Ctrl + S → Save workbook
- Ctrl + C → Copy
- Ctrl + V → Paste
- Ctrl + Z → Undo
- Ctrl + F → Find
- Ctrl + Shift + L → Apply/remove filters
- Ctrl + Arrow Keys → Jump to data edges
Common Mistakes Beginners Make
- Forgetting to start formulas with
=. - Mixing up relative and absolute cell references (
A1 vs $A$1). - Not saving work frequently.
- Overusing manual formatting instead of styles.
- Entering duplicate data instead of using formulas.
Practical Exercises for Beginners
- Create a simple budget sheet with income and expenses. Use
=SUM() to calculate totals. - Build a grade tracker for students. Use
=AVERAGE() to find average scores. - Enter monthly sales data and create a line chart to visualize growth.
- Make a to-do list and apply conditional formatting to mark completed tasks.
Conclusion and Next Steps
This comprehensive beginner’s guide introduced you to the basics of Microsoft Excel. You’ve learned about the interface, workbooks, data entry, formulas, formatting, charts, and tables. By practicing these skills, you’ll be able to manage and analyze data effectively. Once comfortable, you can explore intermediate and advanced topics such as PivotTables, data validation, VLOOKUP, and automation using VBA.
Remember, Excel mastery comes from practice. Open a blank workbook today and start experimenting with the concepts covered in this article.