What is a column in excel?
In Microsoft Excel, a column is a vertical, rectangular space within a worksheet that is identified by a lettered header at the top of the column. Columns are one of the two primary components of a worksheet grid, the other being rows. Together, columns and rows create a cell grid where you can input, organize, and manipulate data.
Here are the key characteristics and functions of columns in Excel:
- Column Header: Each column is identified by a letter in its header, starting with "A" for the first column, "B" for the second, and so on. As you move to the right, the letters continue in alphabetical order (e.g., "C" for the third column, "D" for the fourth, and so forth). The headers appear at the top of the worksheet.
- Column Width: You can adjust the width of a column to accommodate the content it contains. To change the width, position the cursor between the column headers (the line separating two column headers) and drag it left or right to make the column wider or narrower.
- Data Entry: Columns are where you enter data in Excel. You input values, numbers, dates, text, or formulas into individual cells within a column. The data is typically organized vertically in a column.
- Data Organization: Columns are essential for organizing data into categories or fields. For example, you might have a column for names, another for ages, and another for addresses, making it easy to sort, filter, and analyze data.
- Formulas and Functions: Columns are used to perform calculations and apply functions to data. You can write formulas in cells within a column to calculate values based on the data in that column.
- Data Manipulation: Columns are instrumental in data manipulation tasks like sorting and filtering. You can sort data in ascending or descending order based on the values in a specific column, and you can filter data to display only the rows that meet specific criteria in a particular column.
- Column References: When creating formulas or performing operations, you can refer to columns using their headers. For example, you might use "A:A" to refer to all the cells in column A, or "B1:B10" to refer to cells in column B from row 1 to row 10.
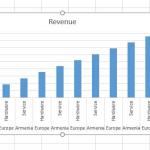
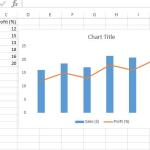
- Chart Data Series: Columns are often used to provide data for chart creation. For instance, a column with sales figures can serve as the data series for a bar chart, with the column headers becoming the chart's category labels.
- Data Validation: You can apply data validation rules to columns to ensure that the data entered meets specific criteria or constraints. This helps maintain data accuracy and consistency.
- Conditional Formatting: Columns can be used as the basis for conditional formatting rules. For example, you can format cells in a column to change color based on specific conditions, making trends or exceptions more visually apparent.
- Column Operations: Excel provides various column-related operations, such as inserting new columns, deleting columns, hiding columns, and freezing columns to keep them visible while scrolling through a wide worksheet.
Row in Excel

Row Column in Excel

Select Entire Column in Excel

In summary, columns in Excel are an integral part of the spreadsheet structure, enabling you to organize, analyze, and manipulate data efficiently. They provide a structured way to work with data in a vertical orientation and are essential for various data-related tasks and calculations within Excel.